The breaching of the 200 Day Moving Average shows that the S&P 500 index is at a crucial juncture and if external events like higher for longer interest rates continue we could be in for a bear market.

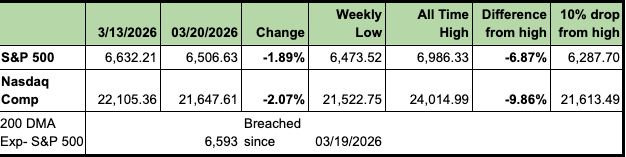
This morning I sent out the newsletter highlighting that the S&P 500 had broken its 200 Day Exponential Moving Average of 6,593 on Friday.
The 200-day moving average is easily the most widely followed technical indicator in global financial markets, and the reason isn't clear; it’s institutional. Even for many of us who focus on fundamentals, this technical indicator is still a very valuable metric to follow and keep track of. The 200 Day Moving Average is institutional as quant funds, pension funds, algo and programmatic traders, systemic funds, CTAs and risk managers all embed this level directly into their models. When the S&P 500 closes below it, it often activates and automates selling from desks that have nothing to do with earnings or fundamentals.
On March 19, the S&P 500 closed below its 200-DMA for the first time since May 2025. We need to follow how much of the breach could lead to just plain caution or sustained selling leading to a bear market .
This is an excellent article on the 200 Day Moving Average, which I really liked and will use extensively to strategize for the broad market. Please read if you get a moment.
https://seekingalpha.com/article/4884943-200-dma-broke-what-every-investor-should-know
I agree with the author’s conclusion that as of now, we are at a cautionary stage, and not plunging into a bear market, and if external circumstances help out, we still get out of it relatively unscathed.
What about the 200DMA - From the article:
The 200DMA is just the average closing price over the previous 200 trading sessions, or 40 weeks, or 10 months of market history. When the index trades above the 200-day average, it suggests the long-term trend is rising. When the index falls below, the long-term trend is deteriorating. Historically, the trend is your friend 71% of the time. Since 1950, the S&P 500 has traded above its 200-DMA during 71% of all trading sessions, and average annual returns during those above-average periods are meaningfully higher than during sessions spent below it.
That is a pretty decent average compiled by the author and it's over a long period of time, so I would take it seriously. The key aspect of the 200DMA break is the level of its break and how long it lasts, and the other conditions which either exacerbate the fall or cushion it into caution or whipsaw it back into ongoing bullish (AI) narrative. As of now, we have more weakening conditions such as:
Which suggests that we could be in for a bad spell, or a further correction.
In recent memory, the worst instances of the 200DMA sustained breaks resulted in bear markets and big drops of over 20%. In each case, the 200DMA was breached and offered investors an exit.
According to the author:
The average one-month return after the break: -5.3%. The average 12-month return: -4.0%. Not a single one of these events posted a positive first-month return. Investors who bought the initial 200-DMA break in 2000 and 2008 were still underwater two full years later.
External circumstances were heavy contributors for the sustained breaks. The bears were right.
In these instances the bears were wrong according to the author:
The index also crossed below the 200-DMA on five other occasions. Notably, in every single case, the market recovered quickly and then launched sharply higher. The fiscal cliff panic in November 2012 and the Ebola and oil scare in October 2014 lasted only days. The second China devaluation and oil collapse in January 2016 lasted just one month. The 10-year yield spike in October 2023 and the Liberation Day tariff shock in March 2025 were also false breaks. Again the liberation day tariff was the first of the TACO trades that have defined this administration. The numbers from those five events stand in stark contrast to the sustained breaks. Average 12-month return: +19.8%. The 2012 fiscal cliff break recovered so fast that the market returned over 28% over the following year. The October 2023 break reclaimed the 200-DMA within weeks and ran +27.0% over 12 months. Crucially, once you get past the first month, every single brief whipsaw event posted positive returns at 3, 6, 9, and 12 months. The hit rate is 100% for investors who didn’t panic-sell on those breaks. For those who did, it was among the most expensive decisions made in those market cycles. The structural difference is what matters most. In every brief break, the 200-DMA was still rising or flat when the price crossed below it. The long-term trend hadn’t broken, as a sentiment shock had temporarily pushed the price below an intact baseline. Fear was already extreme at the moment of the break, which meant the contrarian setup was already in place. As shown, the 200-DMA is still rising, and the long-term trend remains intact.
The author cites six technical and sentiment indicators which consistently helps in separating bull and bear cases.
It is a mixed scorecard, but in my opinion suggests caution as the first step:
Here is the summary and I quote:
Of course, with the war raging in Iran and a melange of TACO type announcements and other tweets, we're nowhere close to getting a firm resolution but at least have a framework, which suggests that we would likely survive this one.
The author also offers good advice, which readers of my regular column have been hearing for the past six weeks, when I suggested that we could be in for a correction and raised my cash level to 25%.
Trim some of the most extended positions. Reduce concentration in your more risky stocks. You’re not betting against recovery — you’re limiting the damage from a potential 12 to 15 percent further drawdown before the low is confirmed.
Build cash to at least 10-15 percent. Cash isn’t a long-term strategy, but it’s a short-term option on the recovery. Dry powder lets you add exposure when a lower low is confirmed rather than being fully deployed into a market still searching for its floor.
Rotate to quality. Favor companies with durable free cash flow, strong balance sheets, and pricing power over high-multiple, low-visibility growth names. The quality factor has historically outperformed in the 3 to 9 months following score-3 and score-4 environments by a meaningful margin.
Add selective defensive sector exposure. A modest 10 to 15 percent shift toward defensives lowers your portfolio’s beta without abandoning equities. With the 10-year falling apart, debt, and gold, are not helping or safe havens either. Extra cash is buying insurance.
I would strongly suggest that readers read and analyze the article, it offers a great deal of thought and will help investors navigate these difficult times.